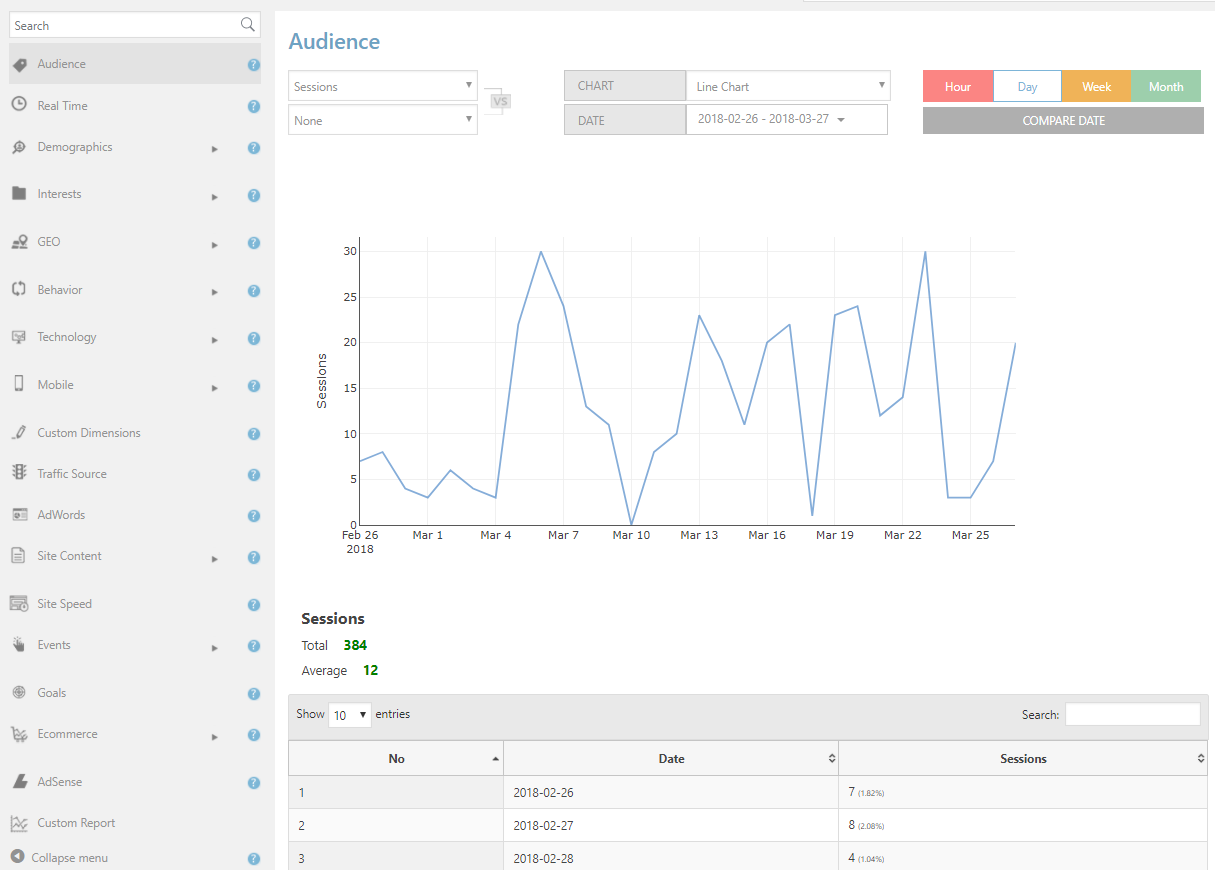
WordPress Google Analytics plugin comes packed with 18 report types, which allow you to gain in-depth information about the traffic and behaviour of your website. Navigate to Analytics > Reports page from WordPress administrative dashboard to access them.
Report Types
Click on the tabs on the left-hand side of this page to access the statistics you wish to check. You can keep track of the audience of any website of your Google Analytics account. Use the select box from the top to pick the tracking site.
Google Analytics plugin lets you review the following report types from your WordPress site:
- Audience. Provides details about new and returning users of your website, sessions, bounces, pageviews, page/sessions and session durations.
- Real Time. Shows the number of active users visiting your website pages at the second the report was opened.
- Demographics. Displays tracking statistics of your website users based on their age and gender.
- Interests. Provides tracking information about site users depending on Affinity Categories (e.g. Music Lovers or Mobile Enthusiasts), In-Market Segments (based on online product purchase interests) and Other Categories (most specific identification, for example, tennis lovers among Sports Fans).
- GEO. Geo-identifier report is built from interactions of location (countries, cities) and language of your website users.
- Behavior. Compares the number of New visitors and Returning users of your website in percents. You can check the duration of sessions with Engagement report.
- Technology. Identifies tracking of the site based on operating systems and browsers visitors use.
- Mobile. Shows statistics of mobile and desktop devices visitors have used while interacting with your website.
- Custom Dimensions. Reports of Custom Dimensions you have added will be displayed under this tab. Step-by-step guide for the setup is in Custom Dimensions section of this guide.
- Traffic Source. Displays overall graph of traffic sources directing to your website.
- AdWords. If your website is registered on Google AdWords, you can link its Google Analytics to AdWords, and gather relevant tracking information with this report.
- Pages. Pages report table will provide you information about Bounces, Entrances, Pageviews, Unique Pageviews, time spent on pages, Exits and Average page loading time.
- Site Speed. Shows the average load time of your website during the specified date range.
- Events. Displays the report based on Events you set up on Google Analytics of your website. Graphs are built based on Event Labels, Categories and Actions.
- Goals. Set Goals from Goal Management and review their Google Analytics reports under this tab. Instructions to set up goals will be provided in Goal Management section of this guide.
- Ecommerce. Check sales statistics of your website by revenues, transactions, products and performance.
- AdSense. Link your Google Analytics and Adsense accounts from Google Analytics Admin setting and keep track of AdSense tracking under this report.
- Custom Reports. Add Custom Reports from any metric and dimension in Custom Reports page, and view relevant Google Analytics tracking information in this tab.

Each report in Google Analytics plugin contains numerous tools. We will discuss them below separately and discover the benefits of Google Analytics reports.
Choosing and Comparing Metrics
Metrics drop-down menus of each report type indicate Google Analytics metrics, based on which the displayed report is built.
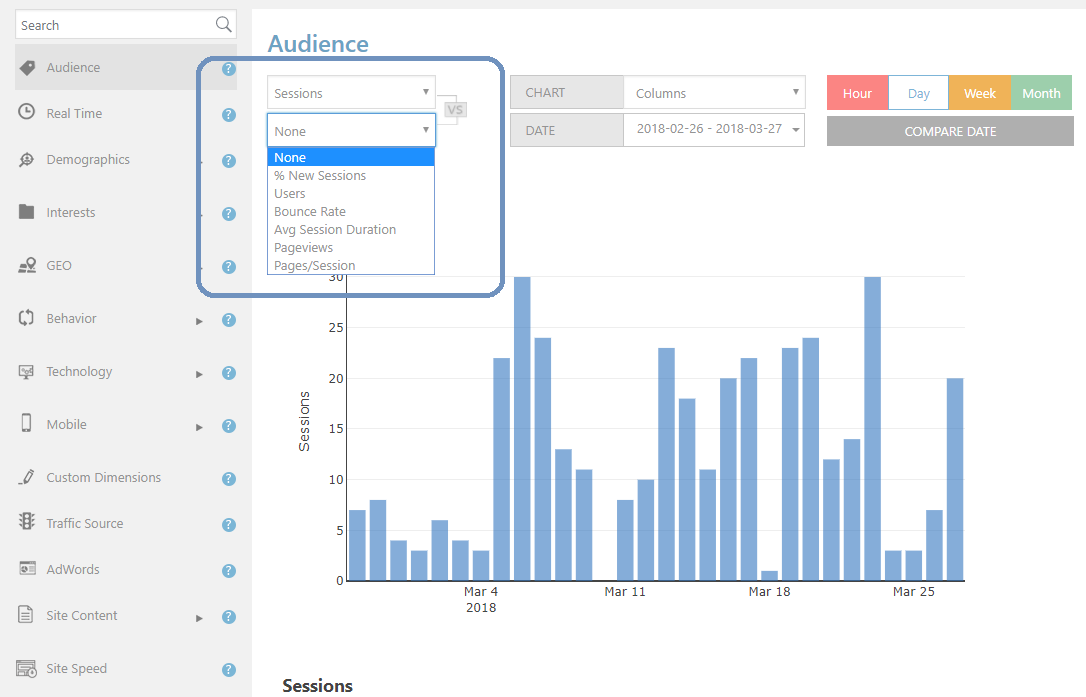
Use the first select box only, in case you would like to view the information of one metric. You can also compare reports of two metrics. Select a value for the second dropdown to see the result.
The following Google Analytics metrics are available with this option:
- Sessions. When users initialize activities on your website during a given time frame, the group of these interactions is considered as a session. It can contain pageviews, events, ecommerce transactions and social interactions.
- New Sessions. Indicates the percentage of new users on your website, who have not visited your website before.
- Users. Shows the total number of users interacting with your website during the selected time period.
- Bounce Rate. The percentage of single page sessions, when the user left your website after visiting only one page.
- Session Duration. The average duration of sessions, that took place on your site during the specified period.
- Pageviews. The number of pages viewed during the selected time frame.
- Pages/Session. Indicates the average number of pages viewed during a session.

Report Charts
The plugin lets you display Google Analytics reports with 3 stunning types of charts, Line, Pie, and Columns.These charts showcase the results of Google Analytics tracking on your website.
- Line. View your website traffic with a line chart. Hover over the graph to check the values of each metric. These values are also displayed under the chart.
- Pie. Check your website traffic results with a pie chart by selecting this option. Values will be calculated as percentages.
- Columns. This option builds a column chart based on selected Google Analytics tracking report of your website. Hover each column to check metrics results on specified dates.
Important note: In case the measurement of X-axis is by date on a report graph, Pie Chart is not available for it. Whereas, if the X-axis is not measured by date, Line Chart is not provided.
Report Date Range
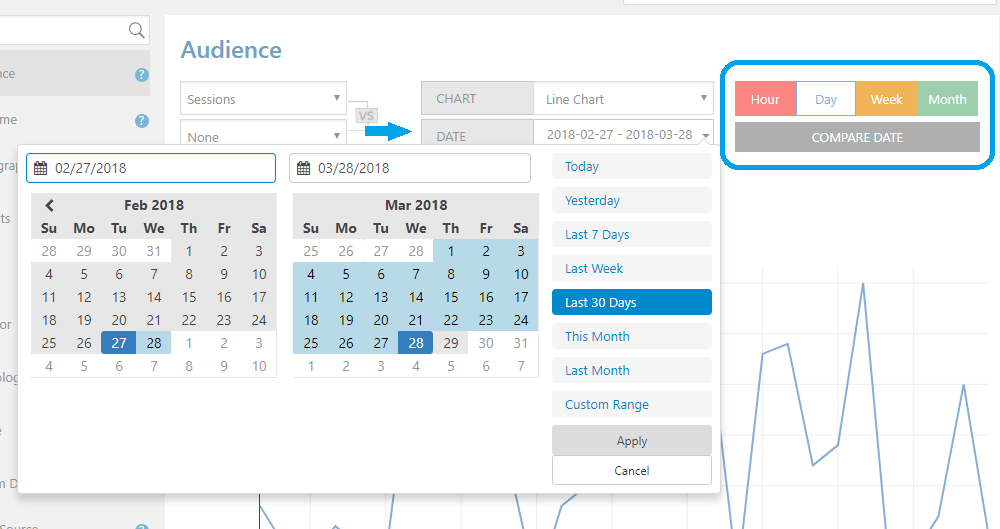
With Reports page of Google Analytics plugin, you can set the time period for your statistics chart using Dateselect box. Pick one of the predefined options:
- Today
- Yesterday
- Last 7 Days
- Last Week
- Last 30 Days
- This Month
- Last Month
or set a Custom Range using two calendars in the toolbox. Click on a date to define the beginning of time frame, and choose the second date to set its ending.
Press Apply after selecting a date range, or Cancel to close the toolbox.
Select the scale of your Google Analytics report by clicking on Hour, Day, Week or Month buttons. The graph of the selected report will be changed accordingly.

Comparing Reports by Dates
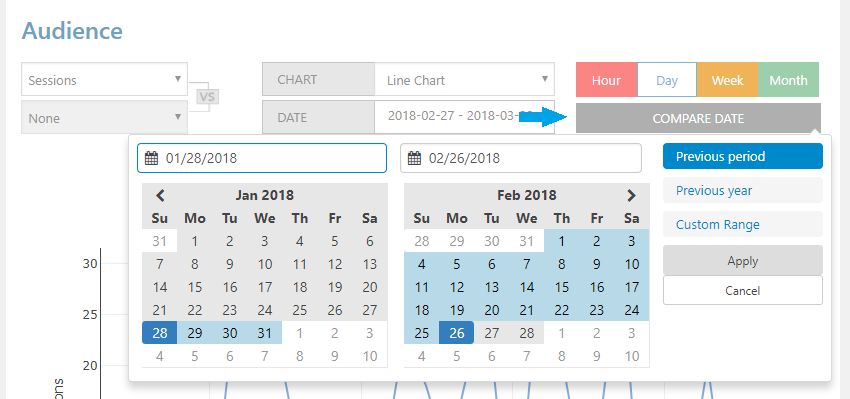
Metrics comparison lets you compare two metrics on a single graph, within a specified date range. Whereas Date Comparison feature measures tracking of one specified metric during two date periods. Click Compare Date button to open date picker, then select one of the following options:
- Previous period. This option automatically sets the previous period of the time frame you selected for Date option. E.g. if you chose Last Week, Previous period option will be set to the week before.
- Previous year. Compares the selected period report with the same period of the previous year.
- Custom range. Use the calendars to set a custom date range for comparison. You can measure statistics of any period with this option. For example, you can set the initial report date range from 22nd of February to 12th of March, 2015, and compare it to 4th to 26th of May, 2016.

v.1.2.0